
Spending $150 in Codex credits to fix a DB bug in production
So last week, we had an incident where a single tenant used up the entire queue of notification deliveries on the knowledge graph because of slow entity resolutions.
Wait, WTH is any of that?
A quick detour into the entity graph
OK, let’s take a step back. I work on the Knowledge Graph team at Grafana Labs, where we create a rich entity graph out of your Prometheus metrics. Without going into too much detail, the way this works is:
- If we see the
upmetric, such asup{cluster="foo", namespace="bar", service="baz"}, we know it’s a service and create a Service entity on the graph. - If we see Kubernetes metrics such as
kube_pod_info{}, we create Pod entities on the graph. - We have a catalog of metric definitions that help us identify other entities like Kafka, Redis, MongoDB, etc.
We combine this data with metrics coming out of Tempo’s Metrics Generator or Beyla’s network monitoring metrics which help define the relationships between these entities.
These entities and relationships are stored in a Redis cluster that is auto-updated every 5min from Prometheus metrics. That way if a pod is killed and its metrics stop reporting, its entity goes stale on the graph and is eventually deleted.
Finally, this leads to a graph of services like the following:
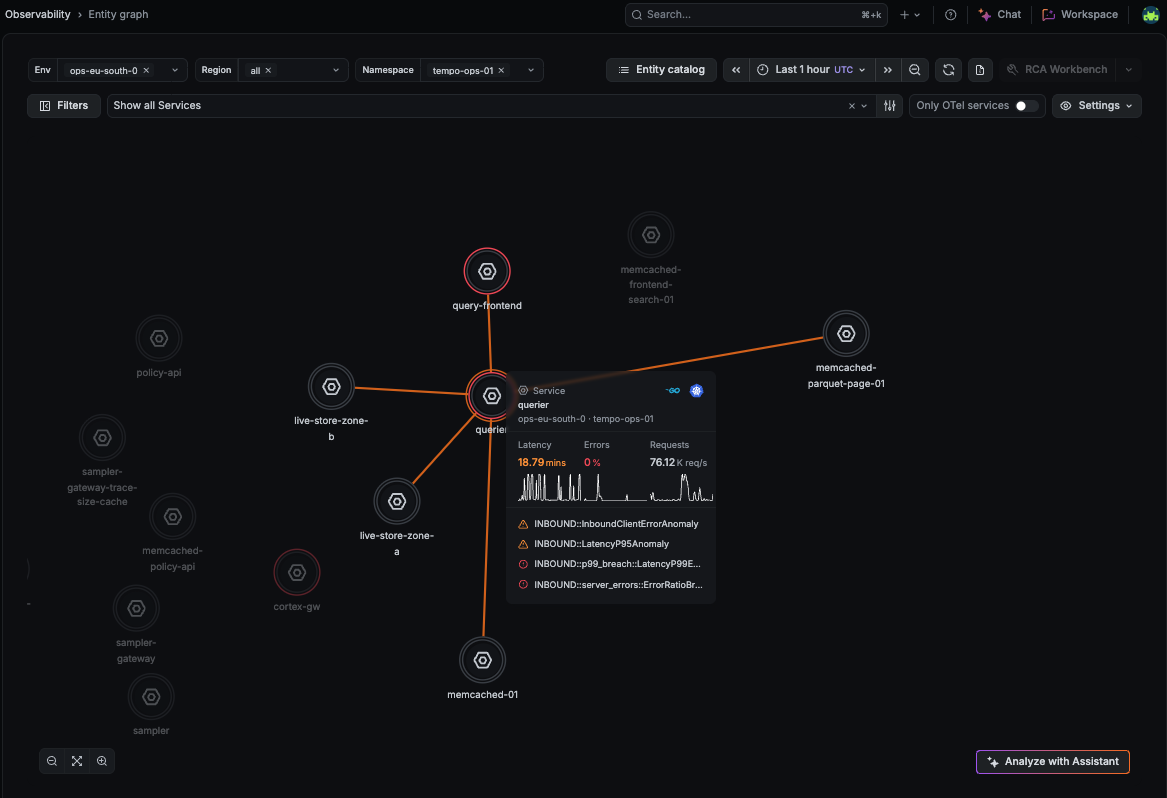
The entity graph showing a service, its dependencies, and associated insights.
One clarification: we use an external vendor for a version of Redis that has advanced graph capabilities for our use case.
Attaching alerts and insights to entities
Entities can be enriched by adding alerts that share the same labels. For example, we might have an alert firing for:
CPUThrottlingHigh{cluster="foo", namespace="bar", service="baz"}
And to match this alert to the right entity, we use the label combination (cluster + namespace + service) to lookup entity information from the Redis cluster. That lets us show a rich UI with both the entity and its insights.
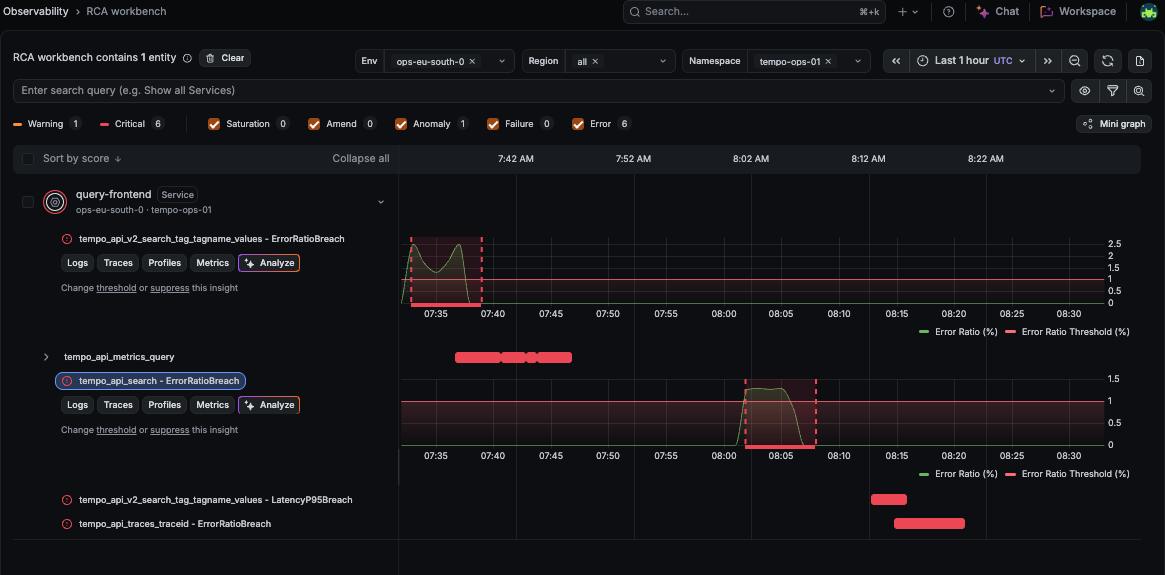
The RCA workbench showing error-ratio and latency insights for a service over time.
The problem
Last week, one of my colleagues noticed that these entity resolutions, which usually take 10–20 ms, were suddenly taking 10 seconds! This meant a single tenant was blocking the entire queue for notification deliveries for about 7 hours. There were also CPU spikes for the same Redis operations because we were looking up some unindexed properties.
So I did the obvious thing and added an index for these properties before rolling it out to our dev, ops, and prod clusters.
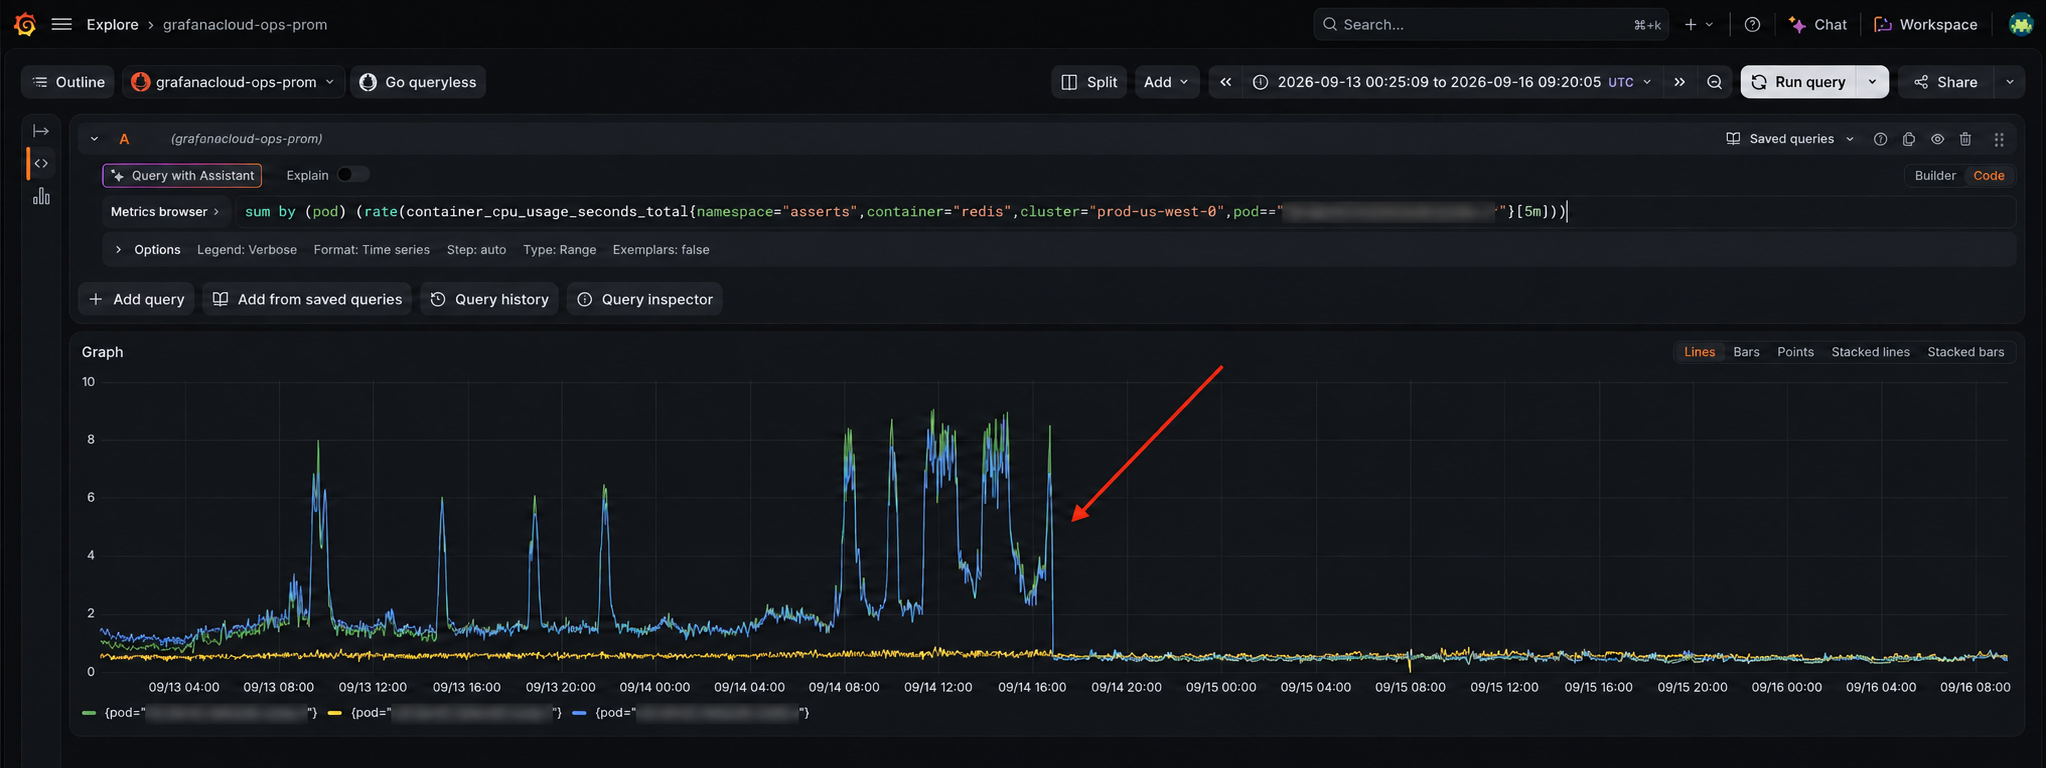
Database CPU usage dropping after the index rollout.
Then the replica divergence alert fired
I was pretty happy with the CPU and latency reduction from these indices, until a ReplicaDivergenceAlert started firing. :(
Turns out the database had a bug where, if a label had more than 10,000 nodes, it could miss some entries in the index.
While we reported this upstream to the database team, my job was to repair the affected indices in production. We started with a simple internal script to sweep the indices on a Redis node, and then I sent Codex off to work through 27 production clusters.
$150 in Codex credits later
With about $150 in credits, Codex with Astra Medium helped scan those 27 clusters and repair affected instances. Adding up one full scan pass per cluster gives 365,808 index-property checks across primary and replica members, excluding extra repeat checks. Each check compared the result of an indexed query with an equivalent forced label scan. That is a count of checks across members, rather than distinct logical indices.
On the first repaired cluster alone, fresh checks found 45 failing property/member comparisons across three database instances. After repair, 18,210 comparisons across all 15 members, plus 81 follow-up checks of previously affected properties, found zero gaps. The other two instances in that cluster were already healthy and needed no repair.
One cluster retained a documented exception for a separate string-indexing defect, which I chose to leave unresolved. The vendor’s underlying index-population bug also remained: this work repaired affected indices, and new online index creation could still recreate the problem.
Now, if you’re wondering why all of this couldn’t have been done with a single script: each cluster had a different number of database deployments, failure modes and ways of accessing it (timed-access, etc). Codex was flexible in ways that would have required a much more complex Bash script.
Here are some examples of things Codex did that would be tough to encode into a Bash script:
- Adapted the repair to the state of each database instance. When all three members had incomplete indices, it rebuilt one replica through a full resync and verified ~1,100 property checks before promoting it. It then verified the resyncs and indices on the remaining members.
- Investigated results that contradicted the database’s status. An index reported
OPERATIONAL, but returned 24,560 matches where a label scan found 24,772. Codex checked the execution plans and equivalent query predicates to confirm the 212 missing matches. - Figured out why timed access wasn’t working. The grant was active, but commands were still denied. Codex traced the mismatch to a direct cloud endpoint and switched to the intended Tailscale access route. I still handled sign-in and access renewal.
- Recovered an interrupted scan without starting over. After a transport timeout, it resumed those checks, identified about ~2,600 missing comparisons and reconciled 10,494 completed checks with no missing or duplicate checks.
- Recognized when the standard repair wasn’t enough. A full resync still left two entries missing. Codex identified a separate string-indexing defect and we reported that bug to the upstream DB team.
Happy hacking!