GPU Observability with eBPF.
If you’re deploying Language/Vision models today, you know that GPUs are the most critical, and often most expensive, component in our infrastructure. Yet, when something goes wrong with a high-stakes training or inference job, the debugging loop turns into slow guesswork.
As an engineer working on observability, I realized we had a critical gap. We’re investing billions in hardware, but our tooling forces us into two camps:
- Hardware Metrics: Tools like DCGM give us utilization, temperature, and power consumption. Essential data, but it only answers: “Is the chip alive and running hot?” It tells us nothing about application logic or efficiency.
- Heavy Profilers: Tools like PyTorch profiler and Nvidia Nsight Systems are powerful and give us deep traces, but they require code changes, introduce significant overhead, and generate massive files. They are too heavy to run continuously in a production cluster.
We needed a solution that offered application-level observability with zero code changes and minimal performance impact.
Our Solution: Auto-Instrumentation via eBPF
The solution lies in eBPF (Extended Berkeley Packet Filter) which allows us to run safe, efficient programs directly within the Linux kernel. It gives us a vantage point that the application code itself can’t see.
Using Grafana Beyla, our open-source auto-instrumentation tool, we harness eBPF to monitor the interaction between the CPU and the GPU, which is the Host-Device handshake. Since every major AI framework (PyTorch, TensorFlow) ultimately communicates with the GPU via CUDA drivers, we can intercept those communications regardless of the high-level framework used.
Tracking the CUDA Driver Calls
We target the most critical functions in the CUDA Runtime API to derive meaningful metrics. This allows us to map the application’s intent directly to GPU workload execution.
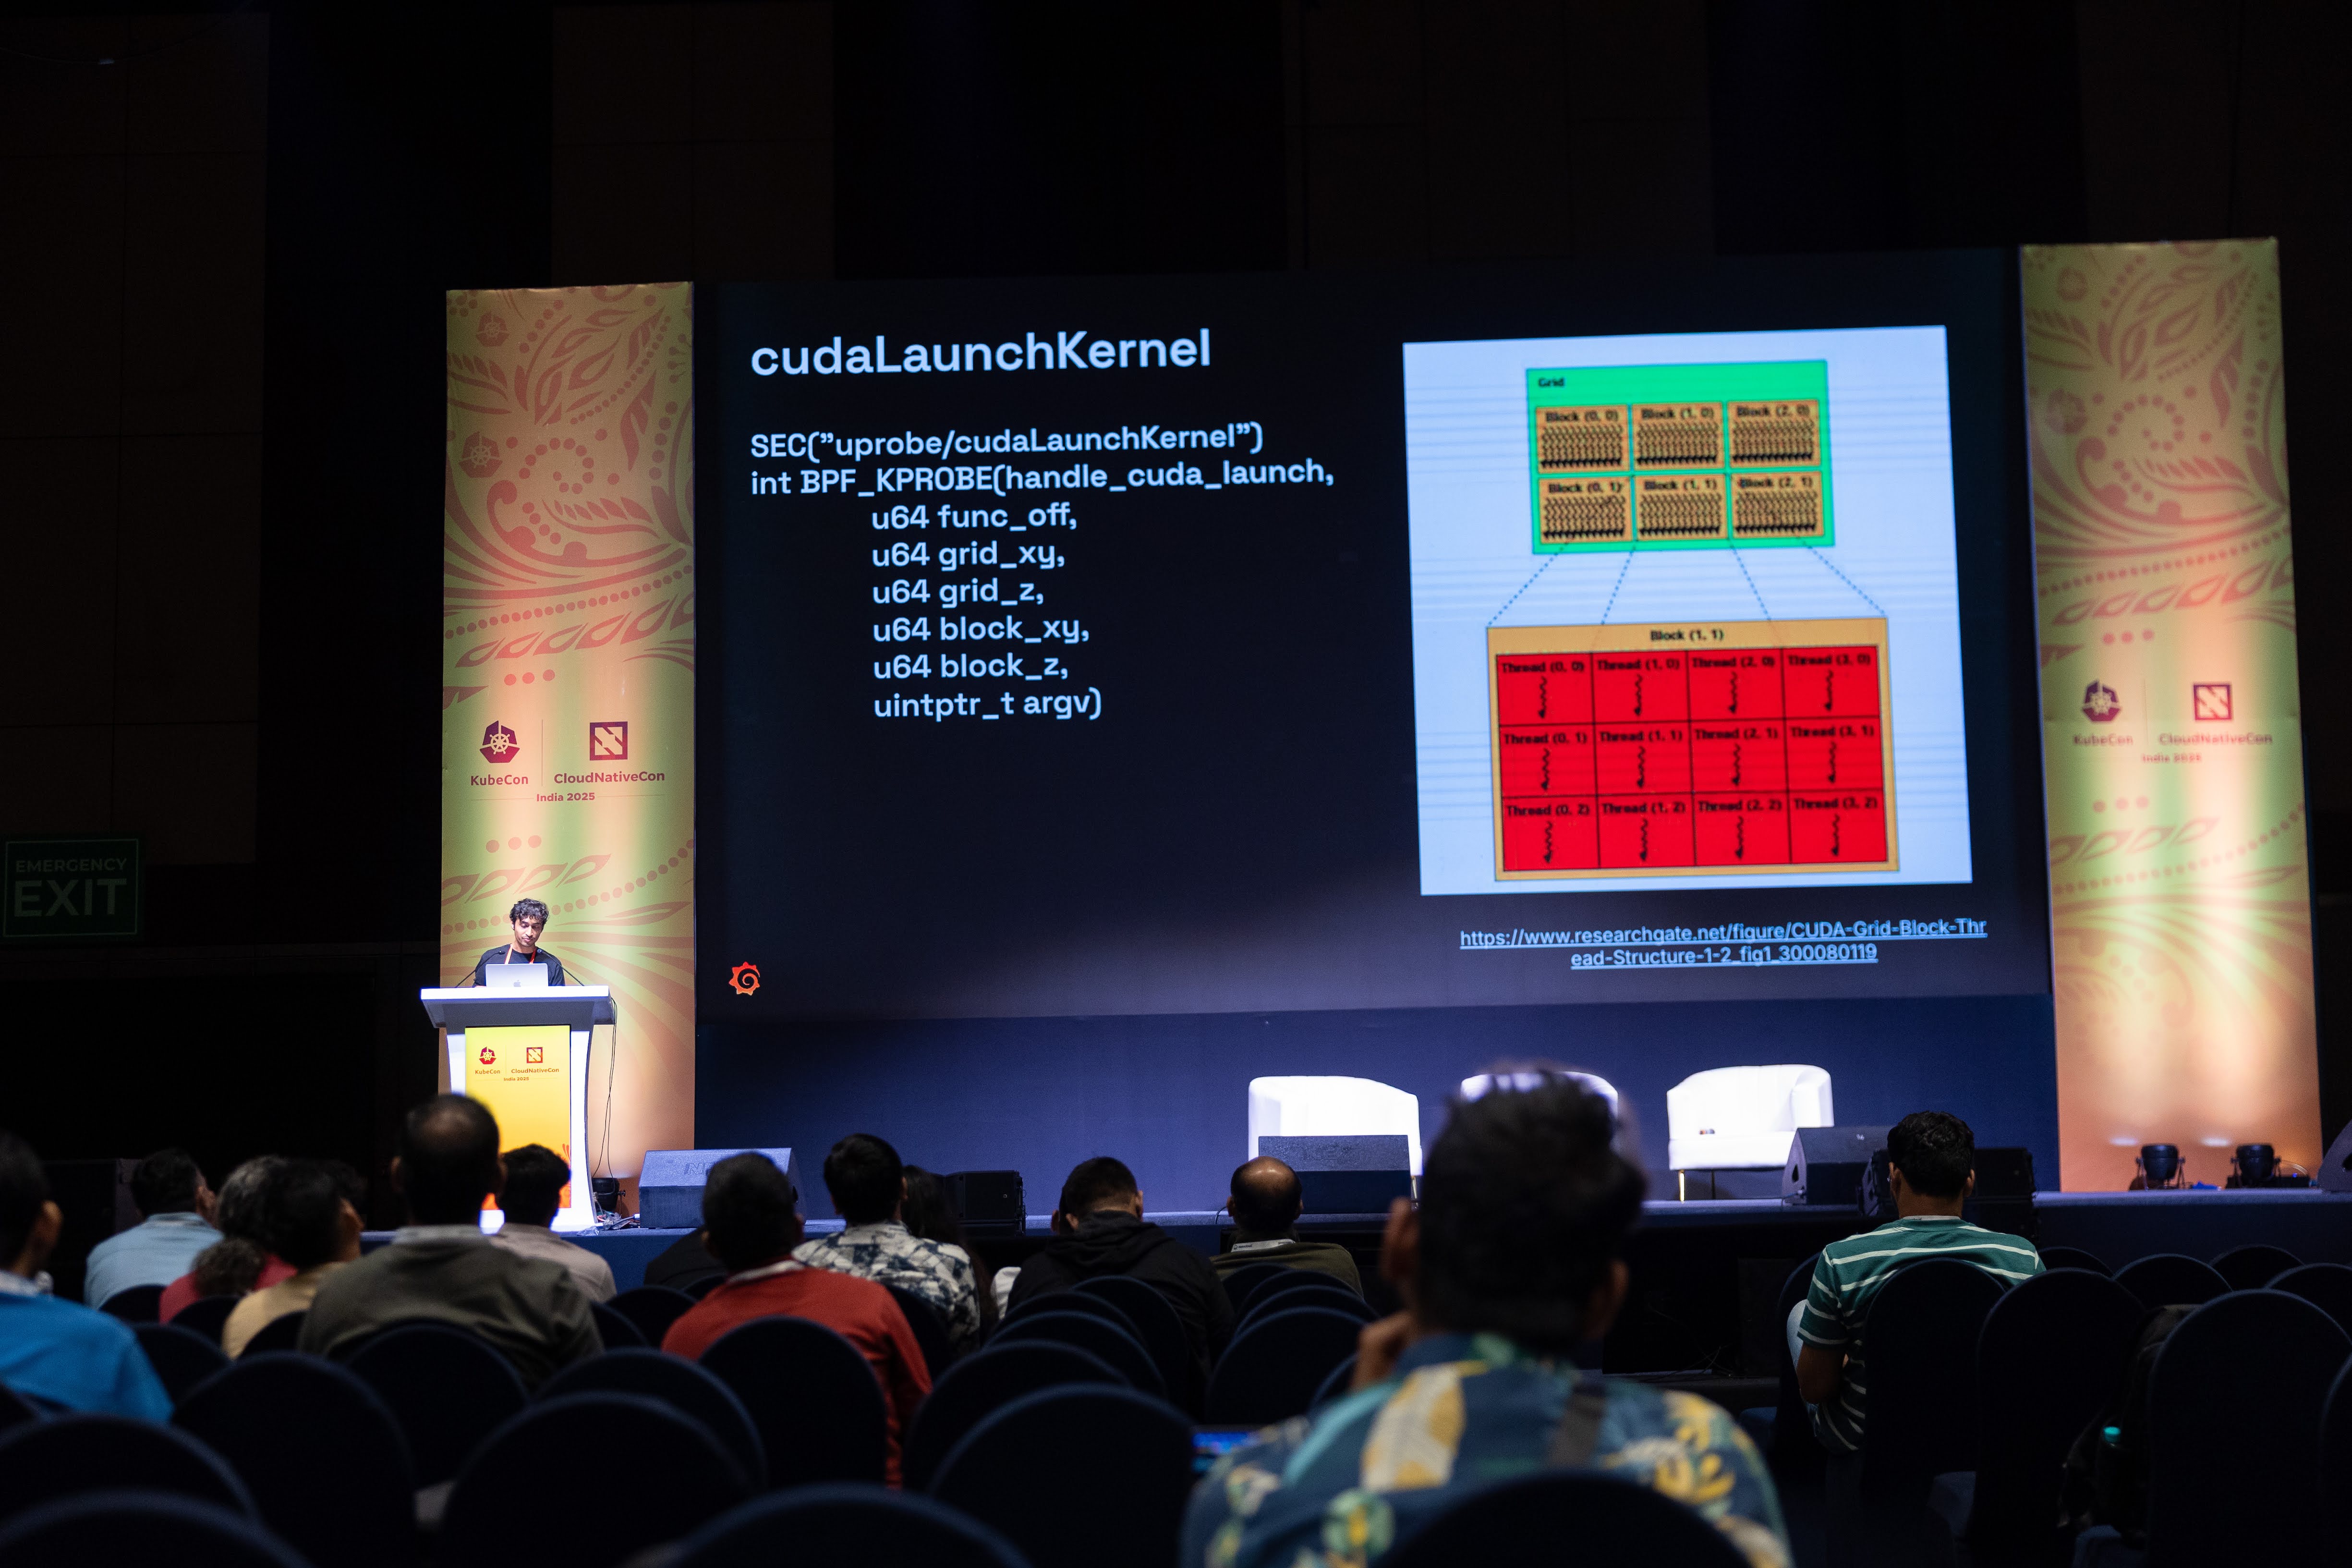
cudaLaunchKernel
We attach our probes here to capture the initiation of parallel computation. This function is executed on the Host (CPU) and initiates the kernel on the Device (GPU).
Tracking this function allows us to precisely capture:
- Kernel Frequency: How often the CPU is enqueuing work.
- Execution Configuration: We capture the Grid Dimensions (total thread blocks) and Block Dimensions (threads per block), which are critical for assessing if the kernel is properly utilizing the hardware.
- Asynchronous Behavior: We observe the function’s fast, asynchronous return, which allows the CPU to queue up subsequent work while the GPU computes in parallel.
cudaMemcpy
This function governs explicit data movement across the high-latency PCIe bus. This is often the primary bottleneck in accelerated computing.
We track calls to cudaMemcpy (and its asynchronous variants) to monitor the transfer of byte counts between:
- HostToDevice (H2D): Input data from CPU RAM to GPU VRAM.
- DeviceToHost (D2H): Results from GPU VRAM back to CPU RAM.
Monitoring the total bandwidth and frequency of these transfers is the key to identifying memory-bound workloads.
Real-World Example: Kernel Fusion
To show the immediate value of these metrics, we compared a standard workload against one optimized using Kernel Fusion—a technique where multiple small operations are combined into one larger, more efficient kernel.
| Metric | Unoptimized Workload | Optimized Workload (Kernel Fusion) | Insight |
|---|---|---|---|
| Kernel Launch Frequency | Extremely High | Massive reduction (5x–10x less) | CPU spends less time managing micro-tasks. |
| Grid Dimensions (Size) | Small, fragmented | Large, maximized | Indicates the kernel is properly saturating the GPU. |
| GPU Utilization | ~60%–70% | Consistent 100% | We verified the optimization delivered full hardware efficiency. |
These metrics were derived using eBPF monitoring and shows the potential of this method in moving GPU programming past guesswork and into structured, data-driven optimization.
The Next Frontier
Our goal is to make Machine Learning infrastructure as reliable and transparent as traditional microservices. By capturing these low-level CUDA events, we are moving toward:
- Full Request Tracing: Correlating a user’s initial HTTP request directly to the specific
cudaLaunchKernelcalls it generated. - Accurate Cost Attribution: Directly linking specific code paths or features to concrete GPU utilization and runtime costs.
Note: This blog is a text version of my talk at KubeCON India (Hyderabad) 2025. You can watch the full presentation here.

Also, the first draft for this blog was written by Gemini 3 Pro by summarizing the presentation video.
